Club Performance Fitting Part 2, How To Use Launch Monitor Data
Second in a series of articles on this new fitting method
By Ed Mitchell, Mitchell Golf Company
In our first article, we discussed the new “club performance fitting” method. This new technical approach to fitting is becoming more popular every day. There are several models of launch monitors available at affordable prices. Some have unique graphics that gives the golfer a visual image of their performance with various demo clubs.
If you recall from our first article, I defined “club performance fitting” as “matching club head performance (size, loft, lie & face angle) to shaft performance (length, flex, weight, bend point & frequency) with a golf ball that produces the highest ball speed launched at the optimum angle with the appropriate spin rate.” The fitting objective is to find the right combination of club specifications that produces the greatest distance for the golfer. Needless to say, the golfer must make good and repeatable swings to produce good data for comparing the performance of each demo club.
That leads us to the purpose of this article. How do you use the launch monitor data to determine the best fit for the golfer? It has become very popular to use launch monitors to fit drivers. Naturally, that is the club that will produce the greatest distance. So that is what we are focusing on in this article. Our Club Performance Fitting Specialist schools we conducted this past year have yielded some interesting data.
I want to point out our golfers played a large part in contributing to variations in the data. The less consistent golfer produced the most variations while the better players averaged less. On occasion, instructional tips where offered and with an adjustment, the golfer showed more consistency. Golfers are not robots and therefore we must recognize each swing recorded by the launch monitor is not necessarily a perfect swing.
It has long been the norm to fit golf shafts by swing speed. It is thought golfers have a “swing speed” that is fairly consistent, which suggests they will swing all drivers within the same 10 mph range. Club head speed has been the benchmark for determining shaft flex and kick point in most fitting systems. Most shaft flexes are graded for club head speed.
However, we found club head speeds can vary significantly for the same golfer. This is true with the same driver and when compared to other drivers. We have seen golfers gain and lose club head speed with different shaft changes. Can you imagine 15 to 20 miles per hour difference in some cases? We also had golfers who did not vary more than 2 miles per hour. Be aware that as the club head speed varies, so does the ball speed. What does that mean? If you remember from my first article, ball speed has the greatest influence on distance. If a golfer does not maintain a consistent club head speed, then the data will vary accordingly.
It is very important that the data being compared should be from consistent face contact. Impact labels should be used and shots not close to center should be deleted. The exception would be contact on the “hot spot” of the driver face. If you can determine the golfer makes consistent contact even though it’s off center and the launch monitor data shows good results, then use the data. Our findings indicated better players had more consistent contact.
In other words as a fitter your job is more difficult with less consistent golfers. But then, they are the ones who need your help the most. With a thorough analysis of the launch monitor data, you should be able to recommend a fit that produces more consistency for them. More consistency produces more distance on average. On the flip side, the better player stands to gain the greatest distance because they generate more ball velocity. You will be able to fit them with a driver that produces more distance easier then you will golfers with slower swing speeds.
Shaft performance contributes greatly to the launch monitor data. Using a matrix of demo clubs with different shafts, our study shows when the only variable between drivers is shaft geometry, we found noticeable changes in ball speed, launch angle and spin rates. Of course this produced different distance results.
In conclusion, I recommend a few simple steps for using launch monitor data for driver fitting. The golfer is the most important element in the fitting process. They must be prepared for the fitting. I recommend they warm up with iron shots before hitting drivers on the monitor.
I suggest you have the golfer test their driver, recording about 6 good swings and evaluating the average of the 6 swings. This will give you an idea of their ability. You should also spec out their driver (size, loft, lie & face angle) and shaft geometry (length, flex, weight, bend point & frequency). Next, take the average of those swings and look at the analysis screen to see if more distance can be gained by increasing or decreasing launch angle and spin rate.
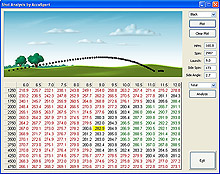
Our analysis screen illustration shows a perfect example of how to use the launch monitor data. In this case our golfer hit a ball traveling 160.8 mph with 2987 rpm’s of spin. It was launched at 9° and traveled 282.9 yards. The analysis screen indicates our golfer will gain 11 more yards by adding 3° more launch angle and reducing the spin rate approximately 237 rpm’s. This example is a PGA Golf Professional with a ball speed 20 to 30 mph more then your average golfer. The average golfer usually swings the club between 80 & 90 mph and produces ball speeds under 140 mph.
With this analysis and knowing the driver’s specifications, you can select a demo driver from your matrix that should produce more distance. For example, driver loft has the greatest influence on launch angle. In our analysis screen the PGA Professional was using a driver with 8.5° loft. If he used the exact same driver in a 9.5° or 10.5° loft, he would increase the launch angle and with less spin would get more distance.
Here are other important factors you should consider incorporating into your “club performance fitting” process. Kick point and/or tip flex will also contribute to the launch angle and spin rate. In making the demo selection, keep in mind consistency comes from repeating face contact. Shaft geometry will greatly effect face contact.
The fitting process should be at a controlled pace. Do not over fit your golfer. If they get fatigued, your launch monitor data will show it. Testing too many drivers will confuse the data. It is important that you pre-determine a direction from the golfer’s own driver analysis, such as loft and shaft geometry.
Golfers will usually want to try any name brand demo club they don’t own. That is a quick way to confuse the golfer and jeopardize your fitting procedure. Remember you are fitting club head and shaft specifications, not club names.
Your fitting objective should always be to gain distance and improve consistency. Use the launch monitor data to determine how to maximize the launch angle and spin rate with the golfer’s consistent swing speed.