
|
|

|
|
2002 Golf Ball Report - Value Category In this test, we compile and examine the performance characteristics of 18 value (<$20) brand golf balls. In addition, two other golf balls (Wilson Staff True Tour, Maxfli Revolution Solid) from the Premium and Mid-Level Category tests are included for benchmarking and comparison purposes. Our testing consists of three phases: Wedge Test, 6-iron Test, and Driver Test. The Wedge Test focuses primarily on initial spin rate (SPIN), the 6-iron Test deals with both distance (DIST) and spin rate (SPIN) equally, and the Driver Test concentrates mostly initial velocity (or overall distance) (DIST). Wedge Test The wedge test was performed using a Titleist DCI OS+ pitching wedge (48° loft) with a target swing speed of 65-69 mph (corresponding to roughly 80-85% of full power and a carry distance of 92-98 yards). Shots hit outside of the 65-69 mph swing speed range were re-tried. After data collection, all shot data was normalized to a 67.0 mph swing speed since spin rate increases with increasing swing speed. However, since the average swing speed for each of the 20 golf ball models was within 0.4 mph of 67.0 mph, the normalization procedure had no impact on the rankings. The data presents the trimmed averages of initial spin rate, SPIN (revolutions per minute) and launch angle, LAUNCH (degrees) for each model of golf ball. Differences of 300 RPM are deemed statistically significant. The data compiled indicates that the Top-Flite Tour was the leader in the wedge spin rates. The Top-Flite Tour was the only ball in this roundup that had spin rates comparble to the benchmark balls (Wilson Staff True Tour, Maxfli Revolution Solid) which were among the previous category leaders. The Top-Flite Tour stood out head and shoulders above every other ball in this category. In fact, no other ball really even came close. Nonetheless, since distance is the primary montra of the value category, the following golf balls are noted with spin rates significantly above the group average (>1000 rpm above the group average): Pinnacle Power Core Soft Feel, Titleist HVC Tour, Nike Power Distance Super-Soft (S), and Top-Flite XL3000 Super Spin. As in the mid-level golf ball category, we see a wide variation in spin rates within this group. On the low end are the Wilson Staff Pro Distance Straight, the Top Flite XL3000 Super Straight, and the Nike Power Distance Hi-Launch (L). These balls appear to be very similar in performance to the Strata Tour Straight (from the Mid-Level Category) in terms of having extremely low spin rates off a wedge (i.e., less than 5000 rpm). 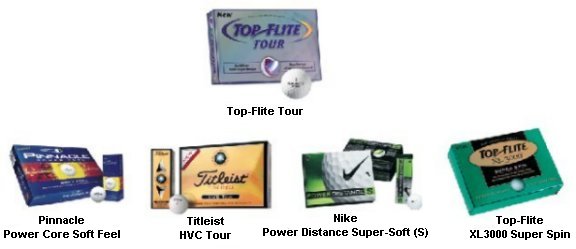
6-iron Test Testing was performed using a Mizuno Comp EZ 6-iron (31° loft) with an average swing speed of 81 mph. The Comp EZ iron was chosen due to its relatively large "sweet spot". Since the swing speed on any individual shot varied generally from 80-82 mph, the shot data were normalized to a speed of 81 mph. However, since the average swing speed for each of the 20 ball models was so close to the target speed of 81.0 mph, the normalization procedure had little impact. The data presents the trimmed averages of carry distance, DIST (yards), smash factor, SMASH (ball speed/club speed), initial spin rate SPIN (revolutions per minute), and launch angle, LAUNCH (degrees) for each model of golf ball. One thing to keep in mind is that the spin rate is the initial rate, not the final spin rate. Different balls have different spin decay rates that can alter the amount of true "bite" power when landing on the green. The data compiled indicated that there are a variety of golf balls available at cheaper prices that can accommodate many golfers. Golf balls that displayed the best combination of distance and spin were the Dunlop LoCo, Pinnacle Power Core Soft Feel, and the Titleist HVC Distance. These golf balls exhibited spin and distance rates above the category group average. Players looking for a little extra bite in the mid-irons would be interested in the Top Flite XL3000 Super Spin, the Nike Power Distance Feel-Speed (F), the Callaway Warbird, and the Pinnacle Power Core Straight. These balls had spin rates on par with the two benchmark balls (Wilson True Tour and Maxfli Revolution Solid) which were overall category leaders in previous testing. Golfers searching for extra distance of of the mid-irons need to look no further than the Nike Power Distance Hi-Launch (L), Wilson Staff Pro Distance Straight, the Precept Laddie, and the Dunlop LoCo. 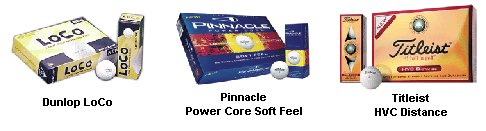
Driver Test Testing was performed using a multitude of drivers: 1) TaylorMade 580 (10.5*, stock R-flex) 2) TaylorMade 360 (10.5*, stock R-flex) 3) Titleist 975J (11.5*, Graphite Design YS6 R-flex) 4) Titleist 975J (10.5*, Graphite Design YS6 R-flex) 5) Callaway Great Big Bertha II (11*, stock R-flex) 6) Callaway Big Bertha Hawk Eye VFT Pro Series (11.5*, stock R-flex) 7) Callaway Big Bertha Hawkeye (11*, stock R-flex) 8) Callaway Biggest Big Bertha (11*, stock R-flex) The multiple driver system was used to mitigate any driver-specific nuances that head or shaft design can play in affecting launch conditions. It also gave us a chance to measure the trampoline affect (smash factor) on a number of different drivers from the past few generations (results to follow soon). Each ball was hit with a given driver the same number of times. A target swing speed of 100-104 mph was used to ensure consistency and accuracy from shot to shot. Shots hit with speeds outside of the target range were deleted and re-tried. One other constraint was used. Drives that landed outside of the 30-yard wide "fairway" on the display (i.e., shots that were more than 15 yards offline) were deleted and re-tried. This yields a more accurate assessment of carry distance and reduces the undesired affect that a widely open or closed clubface at impact can have on the ball's flight characteristics. After all the data was collected, the shot data was normalized to a 102 mph swing speed since items like distance and spin rate are highly dependent on swing speed. The data represent the trimmed averages of carry distance DIST (yards), launch angle LAUNCH (degrees), initial spin rate SPIN (revolutions per minute), and smash factor SMASH (ball speed / swing speed) for each model of golf ball. Note that the carry distance does not include the amount of roll expected after the shot lands which is a complex factor between final launch angle and final spin rate, neither of which is known. Results from the driver tests produced the widest variation in distance results yet, even more than that observed in the Mid-Level Category golf ball test. In fact, there was approximately a 12 yard difference between the shortest and longest ball in this category. We attribute this to several factors: First, there are a larger number of pure distance balls in the group in addition to several pure spin balls; Additionally, there is a wider range of ball compressions within this category; Finally, with golf balls priced at less than $20 per dozen, we feel that there is a wide range of quality. In terms of overall distance, the longest noted within this test were the Nike Power Distance Ti-Velocity (V), Nike Power Distance Hi-Launch (L), and the Top Flite XL3000 Super Long. The Maxfli Noodle and Top Flite Tour followed closely and deserve mention. Given that the Top Flite Tour made it into the top 5 on driving distance is impressive since it lapped the field in the wedge spin test. Of the budget balls that were below average in distance, most of these were either spin balls (i.e., Nike Power Distance Super-Spin (S), Titleist HVC Tour) or low compression balls (i.e., Precept Laddie, Dunlop LoCo). Although it would be speculation, perhaps the low compression balls would compare more favorable on driving distance with golfers that have different swing speeds. 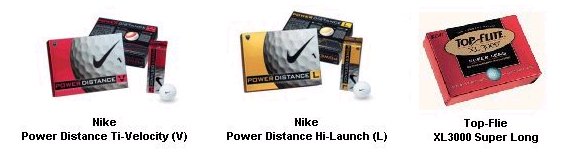
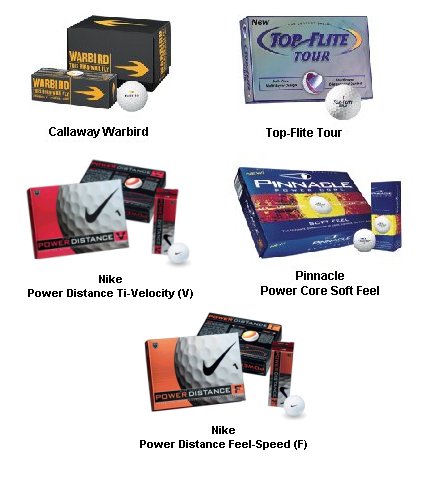
To conclude our analysis of the Value Category, we identified an ideal golf ball as having a combination of high distance off the driver and 6-iron while exhibiting high spin off the 6-iron and wedge. Upon analysis of the golf balls in this category, we created the following table where a check mark indicates that the golf ball ranked above the group average for those particular criteria. As indicated in the table, there was one golf ball that performed above the group average in all four "ideal golf ball" criteria: the Pinnacle Power Core Soft Feel. While not excelling in any one particular area, this ball performed well in all attributes. To further differentiate among the golf balls, a numerical system that was used in the previous premium and mid-priced ball tests is applied. This system computes the number of standard deviations above/below the group mean for each golf ball for each four important performance criteria. The sum of the four standard deviations is computed for each ball and then ranked compared to the same quantity for all the other balls. The ranking in the table reflects the results of the numerical system. Based upon these results, in addition to the Pinnacle Power Core Soft Feel, there were four other golf balls that achieved high overall performance. They were the Callaway Warbird, Top Flite Tour, Nike Power Distance Ti-Velocity (V), and the Nike Power Distance Feel-Speed (F). The Callaway Warbird and Top-Flite Tour had excellent combinations of long driver distance and high wedge spin, and the Nike Power Distance Ti-Velocity (V) exhibited distances that were the class of the field. The Nike Power Distance Feel-Speed (F) was above average in three of the four criteria. Equip2Golf.com identifies these golf balls as 2002 Category Leaders for the Value Category. 
|
|
|

©1998-2003 Equip2Golf, Inc. |